Graphical Representation of Data – Geography Class 12 Notes
Part C: Practical Work in Geography
Chapter – 3
Graphical Representation of Data
1. Need for Graphs and Diagrams
Graphs and diagrams present data visually so that patterns, trends and comparisons can be understood at a glance. General rules: choose a suitable method, give a title, select a suitable scale, show the index (legend), label the axes and mention the source and direction where needed.
2. Line Graph
A line graph shows changes over time (time-series data), such as population growth, temperature or production.
Steps: (1) Draw the X-axis for time and the Y-axis for the variable. (2) Choose a suitable scale (here 1 cm = 200 million). (3) Plot each value against its year. (4) Join the points with a smooth line. (5) Add title, labels and source.

Example: The graph uses Census data of India from 1951 to 2011 and shows rapid growth after 1951.
3. Bar Diagrams
Simple bar diagram: bars of equal width, one for each item, with heights proportional to values. Multiple bar diagram: two or more bars side by side for each year or place to compare variables. Compound (divided) bar diagram: one bar is divided into parts to show the components of a total.

Year | Wheat | Rice | Maize | Total (bar height) |
|---|---|---|---|---|
2020 | 30 | 20 | 10 | 60 |
2021 | 32 | 22 | 12 | 66 |
2022 | 35 | 21 | 14 | 70 |
2023 | 33 | 25 | 15 | 73 |
Steps for a compound bar: find the total for each year, draw bars equal to the totals, then divide each bar starting from the base in the same order of components, and shade each component with a different colour shown in the index.
4. Pie Diagram
A pie diagram is a circle divided into sectors whose angles are proportional to the share of each component in the total. Angle of a sector = (value / total) x 360°.
Land use | Share (%) | Calculation | Angle |
|---|---|---|---|
Agriculture | 45 | 45 / 100 x 360 | 162° |
Forest | 25 | 25 / 100 x 360 | 90° |
Settlements | 12 | 12 / 100 x 360 | 43.2° |
Pasture | 10 | 10 / 100 x 360 | 36° |
Others | 8 | 8 / 100 x 360 | 28.8° |
Total | 100 |
| 360° |

Numerical 1: In a village, agricultural land is 45% of the total area. Find the angle of its sector in a pie diagram.
Given: Share = 45%; total = 100%
Formula: Angle = (value / total) x 360°
Solution: 45 / 100 x 360
Answer: 162°
Numerical 2: A district has 300 sq km of forest out of a total area of 1,200 sq km. Find the angle for forest in a pie diagram.
Given: Value = 300; total = 1200
Formula: Angle = (value / total) x 360°
Solution: 300 / 1200 x 360 = 0.25 x 360
Answer: 90°
Steps: calculate angles, draw a circle of suitable radius, draw a radius from the centre, mark angles one after another (largest first, clockwise), shade sectors and give an index.
5. Climograph (Climatic Graph)
A climograph combines monthly rainfall (shown by bars) and mean monthly temperature (shown by a line) on the same graph, with two vertical scales.
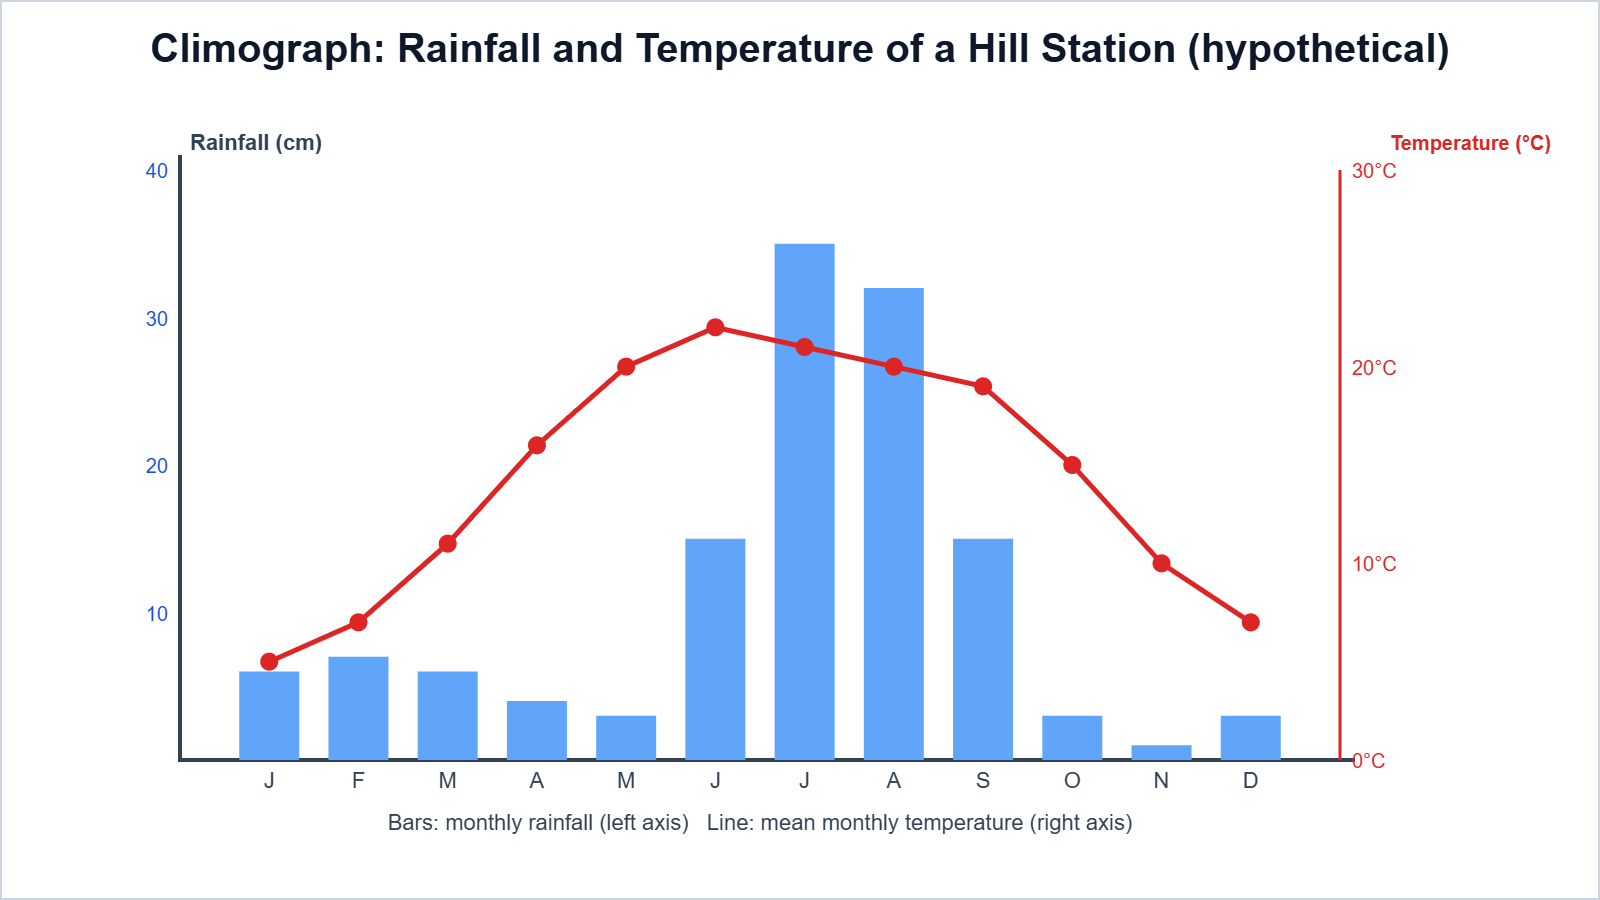
Interpretation (hypothetical hill station): the highest rainfall is in July-August (monsoon), and temperatures are lowest in January and highest in June.
6. Practice Problems (Answers Only)
- Find the pie angle for a value of 25 out of a total of 200. Ans: 45°
- Find the pie angle for 18% of the total. Ans: 64.8°
- Which diagram is best to show change in population over 60 years? Ans: Line graph
- Which diagram shows the components of a total along with the total for several years? Ans: Compound bar diagram
7. Important Questions
Q1. Why are graphs and diagrams used?
Ans. To present data visually so that patterns and comparisons are easy to understand.
Q2. State four general rules for drawing graphs.
Ans. Give a title, choose a suitable scale, label axes and show an index.
Q3. Which data are shown by a line graph?
Ans. Time-series data such as population or temperature over years.
Q4. Distinguish between a multiple bar and a compound bar diagram.
Ans. A multiple bar shows separate bars side by side; a compound bar divides one bar into components.
Q5. Write the formula for the angle of a sector in a pie diagram.
Ans. Angle = (value / total) x 360°.
Q6. What is the total of all angles in a pie diagram?
Ans. 360°.
Q7. What is a climograph?
Ans. A graph showing monthly rainfall as bars and temperature as a line.
Q8. Why does a climograph have two vertical scales?
Ans. Because rainfall and temperature are measured in different units.
Q9. What is a simple bar diagram?
Ans. Bars of equal width with heights proportional to the values of items.
Q10. Find the angle for 50% in a pie diagram.
Ans. 180°.
Easy Memory Trick: Choose the graph: “Time = Line; Compare = Bar; Parts = Pie; Climate = Bar + Line”.
Conclusion: Line graphs, bar diagrams, pie diagrams and climographs make data easy to understand. Correct calculation, scale selection and neat labelling are the keys to good graphical representation.