Data Processing – Geography Class 12 Notes
Part C: Practical Work in Geography
Chapter – 2
Data Processing
1. Measures of Central Tendency
A measure of central tendency is a single value that represents the whole set of data. The three main measures are the mean, median and mode.

2. Mean
The arithmetic mean is the sum of all values divided by their number. For grouped data, the mid-point of each class is multiplied by its frequency.
Numerical 1: Monthly rainfall (cm) at a station for seven months was 12, 18, 25, 30, 22, 15 and 10. Find the mean rainfall.
Given: Values: 12, 18, 25, 30, 22, 15, 10; N = 7
Formula: x̄ = Σx / N
Solution: Σx = 132; x̄ = 132 / 7
Answer: Mean = 18.86 cm
Marks | Mid-point (x) | f | fx | f(x – x̄)² |
|---|---|---|---|---|
0-10 | 5 | 3 | 15 | 1365.33 |
10-20 | 15 | 6 | 90 | 770.67 |
20-30 | 25 | 9 | 225 | 16.00 |
30-40 | 35 | 8 | 280 | 600.89 |
40-50 | 45 | 4 | 180 | 1393.78 |
Total |
| 30 | 790 | 4146.67 |
Numerical 2: Find the mean marks from the grouped table above (marks of 30 students).
Given: Mid-points 5, 15, 25, 35, 45; frequencies 3, 6, 9, 8, 4
Formula: x̄ = Σfx / Σf
Solution: Σfx = 15 + 90 + 225 + 280 + 180 = 790; x̄ = 790 / 30
Answer: Mean = 26.33 marks
3. Median
The median is the middle value when data are arranged in order. It divides the data into two equal halves and is not affected by extreme values.
Numerical 3: Find the median of 12, 18, 25, 30, 22, 15, 10. Then find the median if 35 is added.
Given: Ordered: 10, 12, 15, 18, 22, 25, 30 (N = 7)
Formula: For odd N: middle value ((N+1)/2)th; for even N: mean of the two middle values
Solution: 4th value = 18. With 35 added: 10, 12, 15, 18, 22, 25, 30, 35; middle values 18 and 22; (18 + 22)/2
Answer: Median = 18; with 35 added, median = 20
Numerical 4: Find the median of the grouped marks data.
Given: N = 30; N/2 = 15; cumulative frequencies 3, 9, 18, 26, 30; median class 20-30 (L = 20, cf = 9, f = 9, h = 10)
Formula: Me = L + [(N/2 – cf) / f] x h
Solution: Me = 20 + [(15 – 9) / 9] x 10 = 20 + 6.67
Answer: Median = 26.67 marks
4. Mode
The mode is the value that occurs most frequently. A data set may have one mode (unimodal), two (bimodal) or more.
Numerical 5: Find the mode of 3, 5, 5, 7, 8, 5, 9, 7.
Given: Frequencies: 3 (1), 5 (3), 7 (2), 8 (1), 9 (1)
Formula: Mode = most frequent value
Solution: 5 occurs three times
Answer: Mode = 5
Numerical 6: Find the mode of the grouped marks data.
Given: Modal class 20-30 (highest frequency 9); L = 20, f1 = 9, f0 = 6, f2 = 8, h = 10
Formula: Mo = L + [(f1 – f0) / (2f1 – f0 – f2)] x h
Solution: Mo = 20 + [(9 – 6) / (18 – 6 – 8)] x 10 = 20 + (3/4) x 10
Answer: Mode = 27.5 marks
5. Measures of Dispersion
Dispersion shows how spread out the values are around the central value. Two data sets may have the same mean but different spreads.
Numerical 7: Find the range and coefficient of range of 10, 12, 15, 18, 22, 25, 30.
Given: Largest L = 30; smallest S = 10
Formula: Range = L – S; coefficient = (L – S) / (L + S)
Solution: 30 – 10 = 20; 20 / 40
Answer: Range = 20; coefficient of range = 0.5
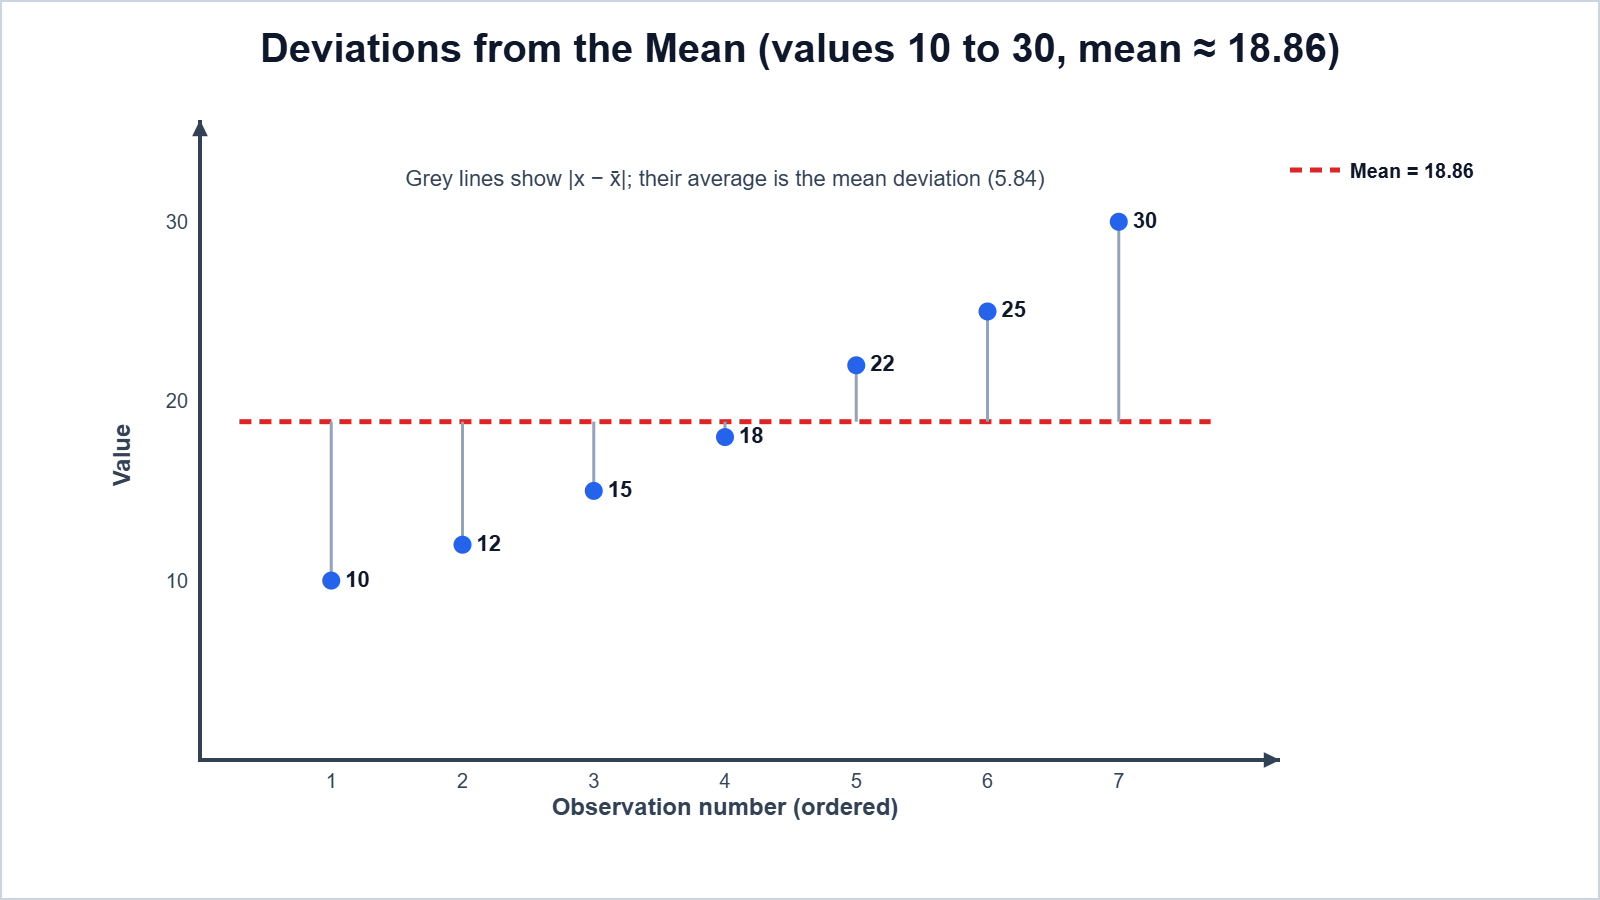
Numerical 8: Find the mean deviation from the mean for 10, 12, 15, 18, 22, 25, 30.
Given: x̄ = 132 / 7 = 18.86; |x – x̄| = 8.86,6.86,3.86,0.86,3.14,6.14,11.14
Formula: MD = Σ|x – x̄| / N
Solution: Σ|x – x̄| = 40.86; MD = 40.86 / 7
Answer: Mean deviation ≈ 5.84
Numerical 9: Find the standard deviation of 2, 4, 4, 4, 5, 5, 7, 9.
Given: N = 8; x̄ = 40 / 8 = 5; (x – x̄)² = 9, 1, 1, 1, 0, 0, 4, 16
Formula: σ = √[Σ(x – x̄)² / N]
Solution: Σ(x – x̄)² = 32; σ = √(32 / 8) = √4
Answer: Standard deviation = 2
Numerical 10: Find the standard deviation of the grouped marks data (mean = 26.33).
Given: Σf(x – x̄)² = 4146.67 (see table); Σf = 30
Formula: σ = √[Σf(x – x̄)² / Σf]
Solution: σ = √(4146.67 / 30) = √138.22
Answer: Standard deviation ≈ 11.76 marks (the same result is obtained by σ = √[Σfx²/N – x̄²] = √(24950/30 – 26.33²))
Remember: a small standard deviation means values are close to the mean (more uniform); a large one means they are widely spread.
6. Practice Problems (Answers Only)
- Find the mean of 20, 30, 40, 50, 60. Ans: 40
- Find the median of 3, 7, 9, 12, 15. Ans: 9
- Find the standard deviation of 2, 4, 6, 8, 10. Ans: 2.83
- Find the coefficient of range if the highest value is 45 and the lowest 15. Ans: 0.5
- Which measure of central tendency is not affected by extreme values? Ans: Median
7. Important Questions
Q1. What is a measure of central tendency?
Ans. A single value that represents a whole data set, such as the mean, median or mode.
Q2. Write the formula for the mean of grouped data.
Ans. x̄ = Σfx / Σf, where x is the mid-point of each class.
Q3. What is the median?
Ans. The middle value of data arranged in order.
Q4. Write the formula for the median of grouped data.
Ans. Me = L + [(N/2 – cf) / f] x h.
Q5. What is the mode?
Ans. The value that occurs most frequently.
Q6. What is dispersion?
Ans. The spread of values around the central value.
Q7. Define range.
Ans. The difference between the largest and smallest values.
Q8. What is mean deviation?
Ans. The average of absolute deviations of values from the mean (or median).
Q9. Why is standard deviation considered the best measure of dispersion?
Ans. Because it uses all values, is mathematically sound and is used in further statistical analysis.
Q10. Which measure is best when data have extreme values?
Ans. The median.
Easy Memory Trick: “Mean adds, Median middles, Mode most often”; Dispersion: “R-M-S” (Range, Mean deviation, Standard deviation).
Conclusion: Mean, median and mode summarise data, while range, mean deviation and standard deviation show their spread. Together they help geographers compare and interpret data accurately.