Analysis of Financial Statements – Class 12 Accountancy Notes
Chapter – 8
Analysis of Financial Statements
1. Meaning of Analysis of Financial Statements
Analysis of financial statements is the process of studying the relationships among the items of the Balance Sheet and the Statement of Profit and Loss, in order to judge the profitability, financial position and efficiency of a business.
2. Significance of Analysis
User | Significance |
|---|---|
Management | To evaluate performance and take decisions |
Investors | To judge profitability and growth before investing |
Creditors and lenders | To judge liquidity and solvency |
Employees | To know the firm’s capacity to pay wages and bonus |
Government | To judge the performance of industries and for policy |
3. Objectives of Analysis
- To assess the current profitability and operational efficiency.
- To find the relative importance of different components of the financial position.
- To identify reasons for changes in profitability and financial position.
- To judge the ability of the firm to repay its debts (short-term and long-term).
- To compare the firm’s performance with other firms and with the industry.
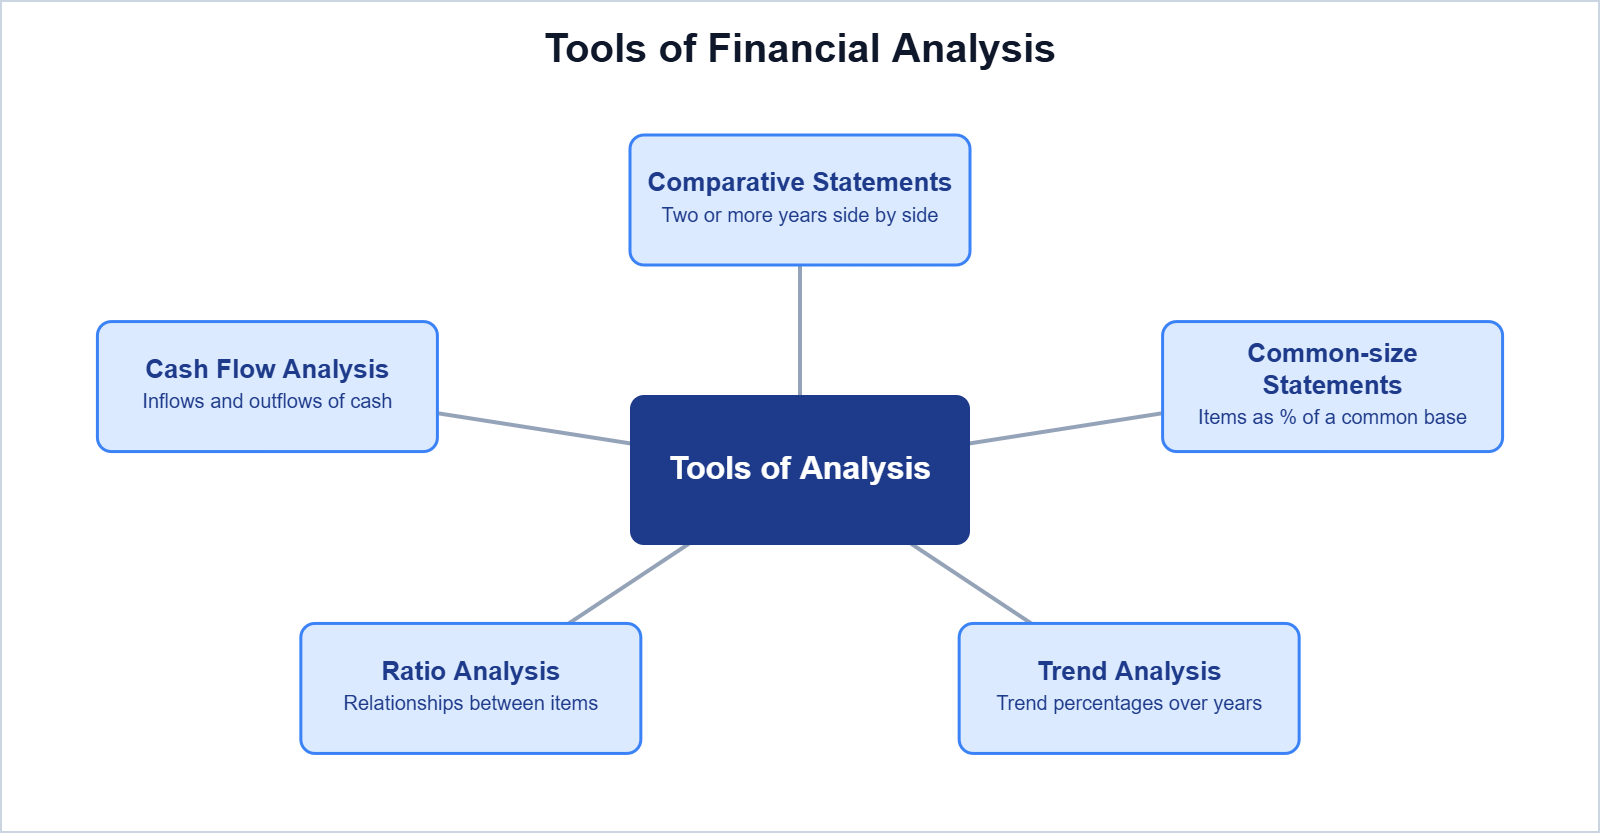
4. Tools of Analysis of Financial Statements
5. Comparative Statements
Comparative statements show the figures of two or more years side by side, with the absolute change and the percentage change.
% change = (Current year – Previous year) / Previous year x 100.
Illustration 1 (Comparative Statement of Profit and Loss): From the following data of PQR Ltd., prepare a Comparative Statement of Profit and Loss.
Particulars | 2023-24 (₹) | 2024-25 (₹) | Absolute change (₹) | % change |
|---|---|---|---|---|
I. Revenue from Operations | 10,00,000 | 12,50,000 | 2,50,000 | 25.00% |
II. Other Income | 50,000 | 40,000 | (10,000) | -20.00% |
III. Total Revenue | 10,50,000 | 12,90,000 | 2,40,000 | 22.86% |
IV. Expenses | 7,00,000 | 8,40,000 | 1,40,000 | 20.00% |
V. Profit before Tax | 3,50,000 | 4,50,000 | 1,00,000 | 28.57% |
VI. Tax @ 30% | 1,05,000 | 1,35,000 | 30,000 | 28.57% |
VII. Profit after Tax | 2,45,000 | 3,15,000 | 70,000 | 28.57% |
Interpretation: Revenue rose by 25%, while expenses rose by only 20%. Therefore profit before and after tax rose by 28.57%, which shows improved efficiency.
Illustration 2 (Comparative Balance Sheet):
Particulars | 31.3.2024 (₹) | 31.3.2025 (₹) | Absolute change (₹) | % change |
|---|---|---|---|---|
I. Equity and Liabilities |
|
|
|
|
Share Capital | 8,00,000 | 10,00,000 | 2,00,000 | 25.00% |
Reserves and Surplus | 1,60,000 | 3,00,000 | 1,40,000 | 87.50% |
Long-term Borrowings | 4,00,000 | 4,00,000 | 0 | 0.00% |
Trade Payables | 2,40,000 | 3,00,000 | 60,000 | 25.00% |
Total | 16,00,000 | 20,00,000 | 4,00,000 | 25.00% |
II. Assets |
|
|
|
|
Property, Plant and Equipment | 9,60,000 | 12,00,000 | 2,40,000 | 25.00% |
Inventories | 2,40,000 | 3,50,000 | 1,10,000 | 45.83% |
Trade Receivables | 2,40,000 | 3,00,000 | 60,000 | 25.00% |
Cash and Cash Equivalents | 1,60,000 | 1,50,000 | (10,000) | -6.25% |
Total | 16,00,000 | 20,00,000 | 4,00,000 | 25.00% |
Interpretation: Total assets grew by 25%. The growth was financed by share capital and reserves; long-term borrowings did not change. Cash decreased slightly, while inventories increased by 45.83%.
6. Common-size Statements
In a common-size statement, each item is shown as a percentage of a common base: revenue from operations for the Statement of Profit and Loss, and total assets (or total equity and liabilities) for the Balance Sheet.
Illustration 3 (Common-size Balance Sheet): Using the data of Illustration 2:
Particulars | 2024 (₹) | 2024 % | 2025 (₹) | 2025 % |
|---|---|---|---|---|
I. Equity and Liabilities |
|
|
|
|
Share Capital | 8,00,000 | 50.00% | 10,00,000 | 50.00% |
Reserves and Surplus | 1,60,000 | 10.00% | 3,00,000 | 15.00% |
Long-term Borrowings | 4,00,000 | 25.00% | 4,00,000 | 20.00% |
Trade Payables | 2,40,000 | 15.00% | 3,00,000 | 15.00% |
Total | 16,00,000 | 100.00% | 20,00,000 | 100.00% |
II. Assets |
|
|
|
|
Property, Plant and Equipment | 9,60,000 | 60.00% | 12,00,000 | 60.00% |
Inventories | 2,40,000 | 15.00% | 3,50,000 | 17.50% |
Trade Receivables | 2,40,000 | 15.00% | 3,00,000 | 15.00% |
Cash and Cash Equivalents | 1,60,000 | 10.00% | 1,50,000 | 7.50% |
Total | 16,00,000 | 100.00% | 20,00,000 | 100.00% |
Illustration 4 (Common-size Statement of Profit and Loss): Using the data of Illustration 1:
Particulars | 2023-24 (₹) | % of revenue | 2024-25 (₹) | % of revenue |
|---|---|---|---|---|
I. Revenue from Operations | 10,00,000 | 100.00% | 12,50,000 | 100.00% |
II. Other Income | 50,000 | 5.00% | 40,000 | 3.20% |
III. Total Revenue | 10,50,000 | 105.00% | 12,90,000 | 103.20% |
IV. Expenses | 7,00,000 | 70.00% | 8,40,000 | 67.20% |
V. Profit before Tax | 3,50,000 | 35.00% | 4,50,000 | 36.00% |
VI. Tax @ 30% | 1,05,000 | 10.50% | 1,35,000 | 10.80% |
VII. Profit after Tax | 2,45,000 | 24.50% | 3,15,000 | 25.20% |
Interpretation: Expenses fell from 70% to 67.2% of revenue, so profit after tax improved from 24.5% to 25.2% of revenue.
7. Limitations of Financial Analysis
- It is based on historical data and ignores price level changes.
- It ignores qualitative factors such as management quality and staff morale.
- Results can be affected by window dressing.
- Different accounting policies make comparison between firms difficult.
- Analysis is only a tool; it needs proper interpretation by experts.
Exam point: In a comparative statement, the percentage change is calculated on the previous year figure; in a common-size statement, each item is expressed as a percentage of the base (revenue or total).
Easy Memory Trick: “Comparative = across years; Common-size = within a year.”
8. Practice Problems (Answers Only)
- Revenue increased from ₹4,00,000 to ₹5,00,000. Find the % change. Ans: 25%.
- Expenses were ₹3,00,000 on revenue of ₹5,00,000. Common-size %? Ans: 60%.
- Total assets ₹10,00,000; inventories ₹1,50,000. Common-size %? Ans: 15%.
- Profit after tax fell from ₹2,00,000 to ₹1,80,000. % change? Ans: (10%) decrease.
9. Important Questions
Q1. What is meant by analysis of financial statements?
Ans. A systematic study of the relationships among items of financial statements to judge profitability, financial position and efficiency.
Q2. Name the tools of financial analysis.
Ans. Comparative statements, common-size statements, trend analysis, ratio analysis and cash flow analysis.
Q3. What is a common-size statement?
Ans. A statement in which each item is expressed as a percentage of a common base.
Q4. What is the base in a common-size Statement of Profit and Loss?
Ans. Revenue from operations.
Q5. Give two limitations of financial analysis.
Ans. It ignores price level changes and qualitative factors.
Q6. State two objectives of financial analysis.
Ans. To assess profitability and to judge the short-term and long-term solvency of the firm.
Conclusion: Comparative and common-size statements turn raw figures into meaningful information, helping users understand trends, structure and performance of a business.