MS Excel: Entering Data, Formatting, Formulas, Functions, Charts and Macros
1. Entering Numbers, Text, Date and Time
(a) Entering Numbers
Numbers are used for calculations.
Examples:
- 100
- 2500.75
- -50
Steps:
- Click a cell.
- Type the number.
- Press Enter.
(b) Entering Text
Text includes names, headings, and labels.
Examples:
- Student Name
- Computer
- January
Steps:
- Select a cell.
- Type the text.
- Press Enter.
(c) Entering Date
Excel automatically recognizes dates.
Examples:
- 25/07/2026
- 25-Jul-2026
(d) Entering Time
Examples:
- 10:30 AM
- 14:45
Excel stores time values and allows time calculations.
2. Series using Auto Fill
Auto Fill automatically fills a sequence of numbers, dates, or text.
Steps:
- Enter the first value (e.g., 1).
- Enter the second value (e.g., 2).
- Select both cells.
- Drag the Fill Handle (small square at the bottom-right corner).
3. Editing and Formatting Worksheet
Formatting improves the appearance of the worksheet.
(a) Changing Font
- Select the cells.
- Choose a font such as Arial, Calibri, or Times New Roman.
(b) Changing Font Size
- Select cells.
- Choose font size (10, 12, 14, 16, etc.).
(c) Changing Font Color
- Select cells.
- Click Font Color and choose a color.
(d) Changing Cell Color
- Select cells.
- Click Fill Color and choose the background color.
(e) Text Alignment
Excel provides several alignment options:
- Left
- Center
- Right
- Top
- Middle
- Bottom
You can also use:
- Wrap Text
- Merge & Center
4. Inserting and Deleting Cells, Rows and Columns
Insert Cell
Home → Insert → Insert Cells
Delete Cell
Home → Delete → Delete Cells
Insert Row
Right-click row number → Insert
Delete Row
Right-click row → Delete
Insert Column
Right-click column letter → Insert
Delete Column
Right-click column → Delete
5. Entering Formula Using Operators
A formula always begins with =.
| Operator | Meaning | Example |
|---|---|---|
| + | Addition | =A1+B1 |
| – | Subtraction | =A1-B1 |
| * | Multiplication | =A1*B1 |
| / | Division | =A1/B1 |
Example
| A | B | Formula |
|---|---|---|
| 10 | 20 | =A1+B1 → 30 |
| 30 | 15 | =A2-B2 →15 |
| 5 | 6 | =A3*B3 →30 |
| 40 | 8 | =A4/B4 →5 |
6. Cell Referencing
(a) Relative Reference
Example: =A1+B1
Sample:
A1+B1
↓
A2+B2
↓
A3+B3
(b) Absolute Reference
Uses the $ symbol.
Example: =$A$1
(c) Mixed Reference
Only row or column remains fixed.
Examples: =$A1 (Column fixed), =A$1 (Row fixed)
7. Statistical Functions
(a) SUM()
Adds numbers: =SUM(A1:A5)
10 + 20 + 30 + 40 + 50 = 150
(b) AVERAGE() (AVG)
Finds the average: =AVERAGE(A1:A5)
(c) MAX()
Finds the largest value : =MAX(A1:A5)
10, 20, 50, 30
Result = 50
(d) MIN()
Finds the smallest value : =MIN(A1:A5)
Result = 10(e) IF() Function
Checks a condition.
Syntax:
=IF(condition, value_if_true, value_if_false)
=IF(A1>=40,”Pass”,”Fail”)
Otherwise → Fail
8. Inserting Tables in Worksheet
A table organizes data neatly.
Steps
- Select data.
- Click Insert tab.
- Select Table.
- Confirm the range.
- Click OK.
9. Embedding Charts in Worksheet
Charts represent data graphically.
Steps
- Select data.
- Click Insert.
- Choose a chart type.
- Excel inserts the chart into the worksheet.
Types of Charts
(a) Line Chart
Shows trends over time.
Example: Monthly sales.
(b) Pie Chart
Shows percentage distribution.
Example: Budget allocation.
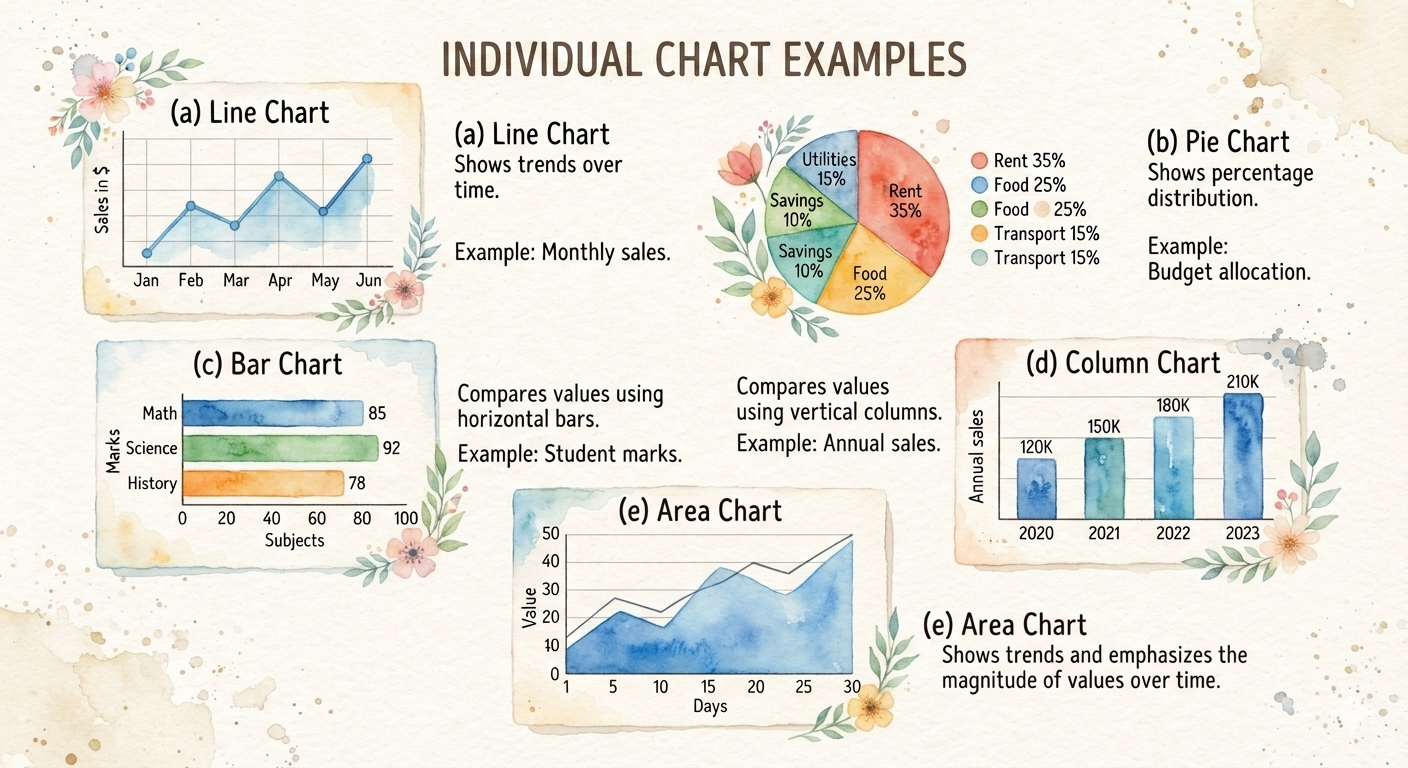
(c) Bar Chart
Compares values using horizontal bars.
Example: Student marks.
(d) Column Chart
Compares values using vertical columns.
Example: Annual sales.
(e) Area Chart
Shows trends and emphasizes the magnitude of values over time.
Example: Population growth.
10. Using Macros in Worksheet
A Macro is a recorded sequence of commands that automates repetitive tasks.
Steps to Record a Macro
- Open the Developer tab.
- Click Record Macro.
- Enter a macro name.
- Perform the required actions.
- Click Stop Recording.
Running a Macro
- Go to Developer → Macros.
- Select the macro.
- Click Run.
Advantages of Macros
- Saves time.
- Automates repetitive tasks.
- Reduces manual errors.
- Increases productivity.
- Performs complex operations with a single click.